Carbon Accounting Software for Dairy Processors in 2026: What to Actually Look For
Quick answer: The right carbon accounting software for a dairy processor isn’t a generic corporate emissions calculator. It needs to model Scope 3 at the farm level (methane, manure, feed, fertiliser), align with CSRD and SBTi FLAG, and go beyond a single footprint number to show which interventions actually pay off, farm by farm. Most “carbon software” on the market wasn’t built for that.
Why Generic Carbon Software Doesn't Work for Dairy
Most carbon accounting platforms were built for corporate offices: electricity bills, business travel, office waste. That’s Scope 1 and 2, and for a dairy processor, it’s a rounding error.
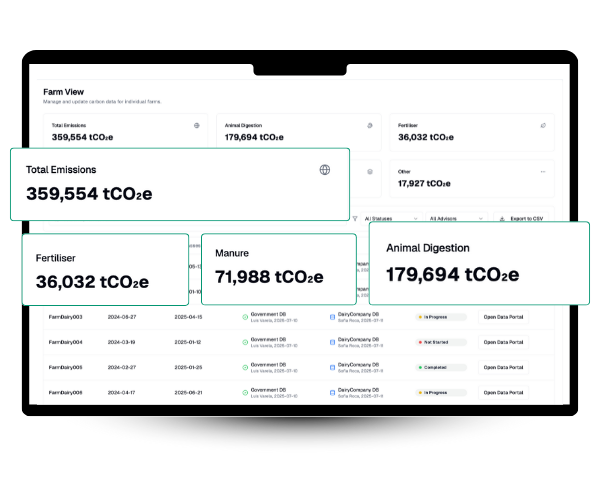
For dairy, over 90% of total emissions sit in Scope 3, mostly from farms the processor doesn’t directly control: enteric methane from the herd, nitrous oxide from manure and fertiliser, and the feed supply chain. A tool designed for office carbon simply has no model for any of that.
This is why so many dairy processors end up with a number they can report but can’t act on. A footprint tells you where you stand. It doesn’t tell you what to do next, or what it will cost.
What to Look For in 2026
If you’re evaluating carbon accounting software for a dairy business, here’s what actually matters:
1. Farm-level Scope 3 modelling, not averages
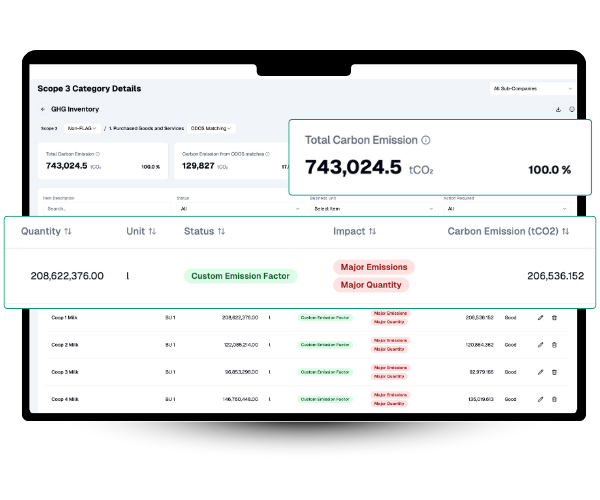
The software should calculate emissions from real farm data, herd size, feed type, manure handling, fertiliser use, not apply a single national average across your entire supply base. Averages hide your biggest opportunities and your biggest risks.
2. Built-in alignment with CSRD and SBTi FLAG
From 2024, the EU’s Corporate Sustainability Reporting Directive requires detailed, auditable disclosure across climate, biodiversity, and land use. The Science Based Targets initiative’s FLAG guidance sets sector-specific rules for emissions and removals from farming and land systems. A platform that wasn’t built around these frameworks will leave you retrofitting your data later, at the worst possible time.
3. A path from number to action
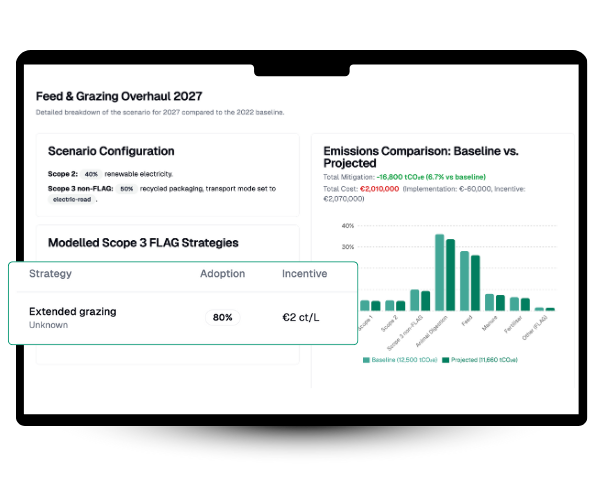
A footprint is the starting point, not the deliverable. Look for software that can model specific interventions, methane-reducing feed additives, manure management upgrades, multispecies swards, and show the cost per tonne of CO2 abated for each one. Without this, “reduce emissions” stays a mandate with no plan behind it.
4. Verified insetting, not generic offsetting
Reductions should land inside your own supply chain and inside your reported footprint, not get outsourced to unrelated offset projects elsewhere. If you’re rewarding farmers for action, you need to prove that action actually happened and actually reduced emissions, not just that a payment was made.
5. Biodiversity as a native metric, not an add-on
CSRD already requires disclosure on land use and ecosystem impact. Platforms that treat biodiversity as a separate, bolted-on module tend to produce inconsistent, hard-to-audit results. Habitat and land-cover data should sit alongside your emissions data from the start.
6. Works with what you already have
You likely already use Cool Farm Tool, a national calculator, or an agronomist platform. The right software should integrate with these, not force a second round of data collection. Complement, don’t replace, is the safer bet for adoption.
7. Usable by the people entering the data
The best system is the one your field teams and farmers will actually use. If data collection is complex or time-consuming, adoption fails before the software matters at all.
A Real Example: What "Beyond Measurement" Looks Like
Farm Zero C, a joint research project between Carbery Group, University College Dublin, Trinity College Dublin, and ODOS Tech, set out to build one of the first carbon-neutral dairy farms. It’s a useful example of what happens when carbon accounting goes further than a number.
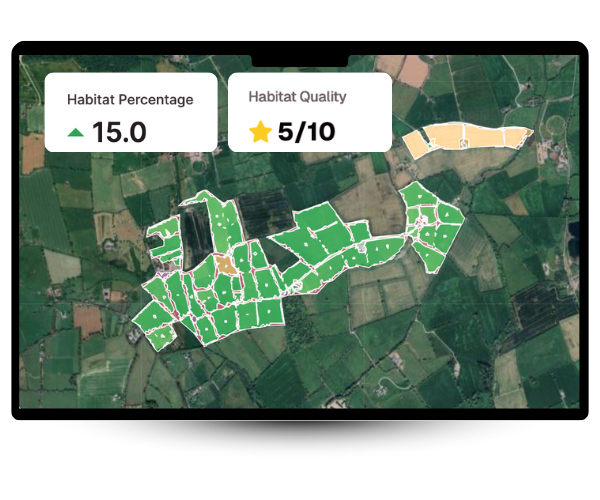
Rather than stopping at a footprint, the project used habitat mapping to identify where land could be shifted toward nature-positive use, without cutting productivity, alongside farm-level emissions reduction work. The result was a measurable increase in on-farm biodiversity from 7.5% to 10%, with emissions falling and output holding steady.
That’s the difference between a platform that measures and one that helps you act.
How ODOS Tech Approaches This
ODOS Tech was built specifically for livestock supply chains, not adapted from a generic corporate carbon tool. For dairy processors, that means:
- Farm-level Scope 1, 2, and 3 (FLAG) emissions modelling, built on real herd, feed, and manure data rather than averages
- CSRD- and SBTi FLAG-aligned reporting from the ground up, not retrofitted
- A mitigation toolbox modelling 30+ science-backed interventions, each with a marginal abatement cost, so you can see euro-per-tonne economics before you invest, not after
- Verified, evidence-backed insetting, so reductions are tied to specific on-farm actions and land in your reported footprint
- Biodiversity measured natively via satellite and AI, alongside emissions, not as a separate workstream
- Integration with tools you already use, including Cool Farm Tool and national calculators, so there’s no second data collection exercise
The goal isn’t another dashboard. It’s turning your climate data into a defensible plan, and a credible report.
Choosing carbon accounting software is really choosing how your next five years of sustainability reporting will go. Get the foundation right, and everything after it, mitigation planning, insetting, biodiversity disclosure, gets easier.